Railay has a tropical monsoon climate. Temperatures barely move through the year, so the difference between months is rain, not heat: January and February are the driest, October the wettest.
The figures below are Krabi climate data for 1981 to 2010, as shown on Wikipedia (mean daily maximum and minimum, average monthly rainfall and rainy days). Individual years vary, so read every month as a tendency, not a forecast.
The year at a glance
Tap or hover a month. Colour shows how good it is for a trip, bar height shows how much it rains.
Best weather Good Transition Wet season
Bar height = average monthly rainfall. Crowds and prices: Quiet and cheaper · In between · Busiest and priciest
January
Best weather
One of the two driest months. High season: busiest and priciest.
Daily high 32.9° / low 21.6°
Rain 32 mm · 5.3 rainy days
Busiest and priciest
What is open and when
JFMAMJJASOND
High season: busiest and priciest (roughly November to April)
Ferries between Ko Lanta, Ko Phi Phi and Phuket Town more frequent (November to May)
Temperatures and rainfall: Krabi climate data 1981 to 2010 as shown on Wikipedia (mean daily maximum and minimum, average monthly rainfall and rainy days). High and low season: Wikivoyage's Ao Nang page (high season roughly 1 November to 30 April). Levels follow the driest to wettest months in the data.
December: Drier again, and popular. High season: busiest and priciest. Average high 31.4 °C, low 21.7 °C; about 67.8 mm of rain over 10.1 rainy days.
January: One of the two driest months. High season: busiest and priciest. Average high 32.9 °C, low 21.6 °C; about 32.0 mm of rain over 5.3 rainy days.
February: The driest with January, and the temperatures start to climb. High season: busiest and priciest. Average high 34.2 °C, low 22.0 °C; about 43.4 mm of rain over 4.5 rainy days.
Hot, with the rain returning: March and April
March: The hottest month in the table. High season: busiest and priciest. Average high 34.3 °C, low 23.0 °C; about 98.3 mm of rain over 8.7 rainy days.
April: Hot, with the rain returning. High season: busiest and priciest. Average high 34.1 °C, low 23.6 °C; about 147.2 mm of rain over 11.7 rainy days.
The rainy months: May to October
May: The rains set in. Low season: fewer visitors, some places close. Average high 32.9 °C, low 23.7 °C; about 171.6 mm of rain over 15.9 rainy days.
June: Wet. Low season: fewer visitors, some places close. Average high 31.9 °C, low 23.3 °C; about 192.7 mm of rain over 15.8 rainy days.
July: Wet. Low season: fewer visitors, some places close. Average high 31.5 °C, low 23.0 °C; about 201.1 mm of rain over 18.3 rainy days.
August: Wet. Low season: fewer visitors, some places close. Average high 31.4 °C, low 22.9 °C; about 266.3 mm of rain over 18.0 rainy days.
September: Among the wettest months. Low season: fewer visitors, some places close. Average high 31.2 °C, low 22.9 °C; about 275.2 mm of rain over 18.5 rainy days.
October: The wettest month: 323.5 mm over 21.5 rainy days. Low season: fewer visitors, some places close. Average high 31.3 °C, low 22.4 °C; about 323.5 mm of rain over 21.5 rainy days.
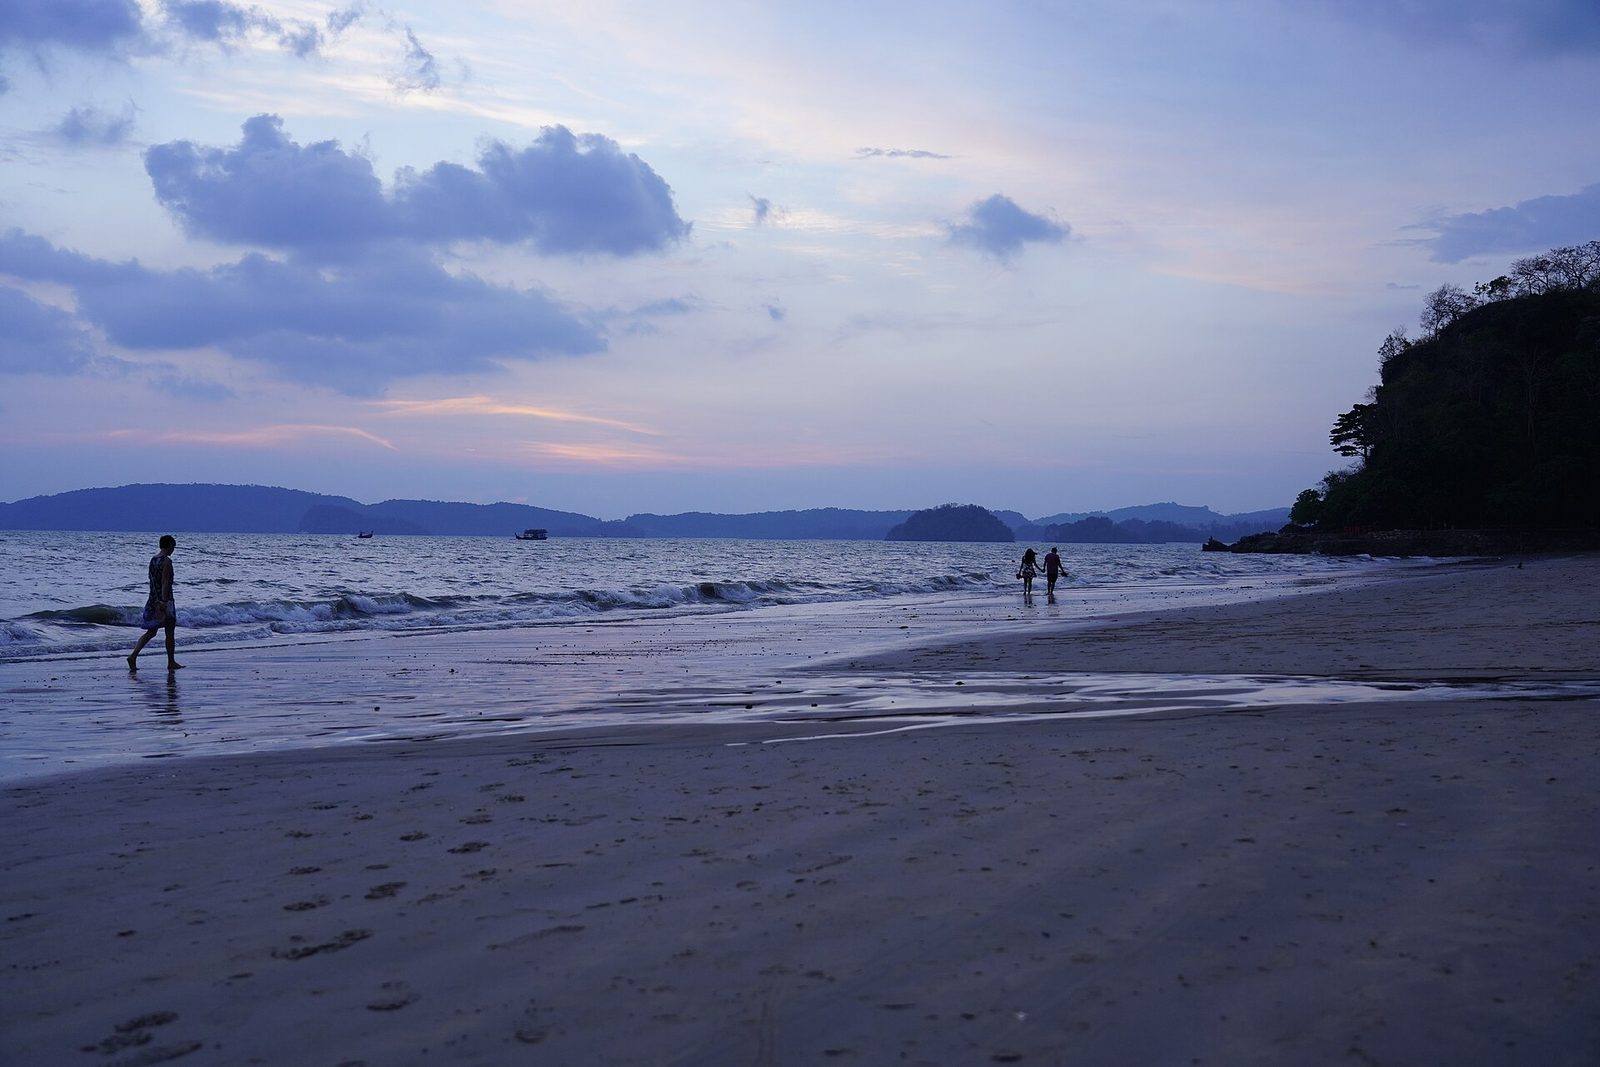
Ao Nang at dusk
November: the switch
November: Rain eases and the high season begins. High season: busiest and priciest. Average high 31.1 °C, low 22.5 °C; about 179.7 mm of rain over 17.6 rainy days.
How to use this
For the driest weather, aim for December to February. January averages about 32 mm of rain over 5.3 days, February about 43.4 mm over 4.5 days.
For the lowest prices, May to October is low season, but it is wet: October averages 323.5 mm over 21.5 rainy days, and some places close. Check that your hotel and the tours you want are running.
Boats matter more than beach days: rough seas are what usually cancels an outing, and ferries between Ko Lanta, Ko Phi Phi and Phuket Town are more frequent from November to May.


 Top pickFrom US$37